Note
Go to the end to download the full example code.
Experiments
import matplotlib.pyplot as plt

from ai4water.experiments import MLRegressionExperiments

from utils import prepare_data, SAVE
from utils import set_rcParams
from utils import print_version_info
print_version_info()
python 3.12.7 (main, Nov  5 2024, 16:16:58) [GCC 11.4.0]
os posix
ai4water 1.07
xgboost 2.1.3
easy_mpl 0.21.4
SeqMetrics 2.0.0
torch 2.5.1+cu124
numpy 1.26.4
pandas 1.5.3
matplotlib 3.8.4
sklearn 1.3.1
xarray 2024.3.0
netCDF4 1.7.2
seaborn 0.13.2
bnlearn 0.10.2
Script Executed on:  Wed Jan  1 06:31:17 2025
tot_cpus 2
avail_cpus 2
mem_gib 7.612831115722656
set_rcParams()
data, _, _ = prepare_data()
comparisons = MLRegressionExperiments(
    input_features=data.columns.tolist()[0:-1],
    output_features=data.columns.tolist()[-1:],
    split_random=True,
    seed=1575,
    verbosity=0,
    show=False
)
comparisons.fit(
    data=data,
    run_type="dry_run",
    include=['XGBRegressor',
             'AdaBoostRegressor', 'LinearSVR',
             'BaggingRegressor', 'DecisionTreeRegressor',
             'HistGradientBoostingRegressor',
             'ExtraTreesRegressor', 'ExtraTreeRegressor',
             'LinearRegression', 'KNeighborsRegressor',
             'RandomForestRegressor',
             'SGDRegressor', 'SVR',
             'LassoCV', 'RidgeCV',
             ]
)
***** Training *****
input_x shape:  (584, 14)
target shape:  (584, 1)
***** Validation *****
input_x shape:  (146, 14)
target shape:  (146, 1)
***** Test *****
input_x shape:  (314, 14)
target shape:  (314, 1)
running  XGBRegressor model
running  AdaBoostRegressor model
running  LinearSVR model
running  BaggingRegressor model
running  DecisionTreeRegressor model
running  HistGradientBoostingRegressor model
running  ExtraTreesRegressor model
running  ExtraTreeRegressor model
running  LinearRegression model
running  KNeighborsRegressor model
running  RandomForestRegressor model
running  SGDRegressor model
running  SVR model
running  LassoCV model
running  RidgeCV model
set_rcParams({'xtick.labelsize': '14',
'ytick.labelsize': '14'})
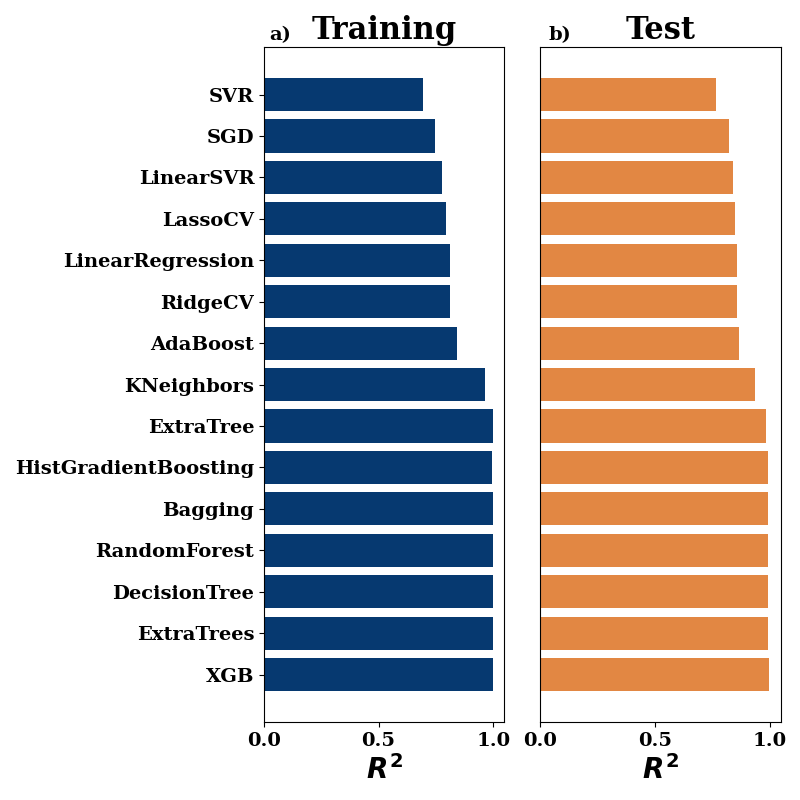
_ = comparisons.compare_errors(
'r2',
data=data,
colors=('#063970', '#e28743'),
figsize=(8, 8),
)
fig = plt.gcf()
fig.text(0.35, 0.95, 'a)', ha='center', fontsize=14)
fig.text(0.7, 0.95, 'b)', ha='center', fontsize=14)
plt.tight_layout()
# plt.savefig("../manuscript/figures/figS1.png", dpi=600, bbox_inches="tight")
plt.show()
***** Training *****
input_x shape:  (584, 14)
target shape:  (584, 1)
***** Validation *****
input_x shape:  (146, 14)
target shape:  (146, 1)
***** Test *****
input_x shape:  (314, 14)
target shape:  (314, 1)
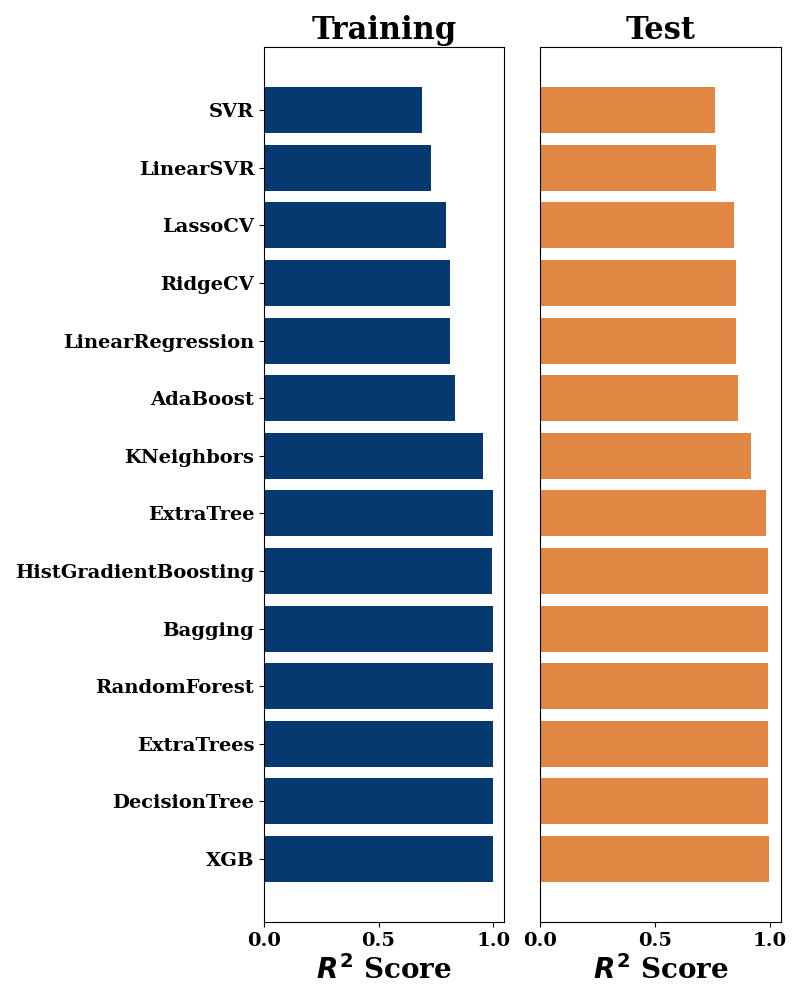
r2_score = comparisons.compare_errors(
    'r2_score',
    data=data,
    figsize=(8, 10),
    cutoff_type='greater',
    cutoff_val=0.5,
    colors=('#063970', '#e28743')
)
plt.tight_layout()
plt.show()
***** Training *****
input_x shape:  (584, 14)
target shape:  (584, 1)
***** Validation *****
input_x shape:  (146, 14)
target shape:  (146, 1)
***** Test *****
input_x shape:  (314, 14)
target shape:  (314, 1)
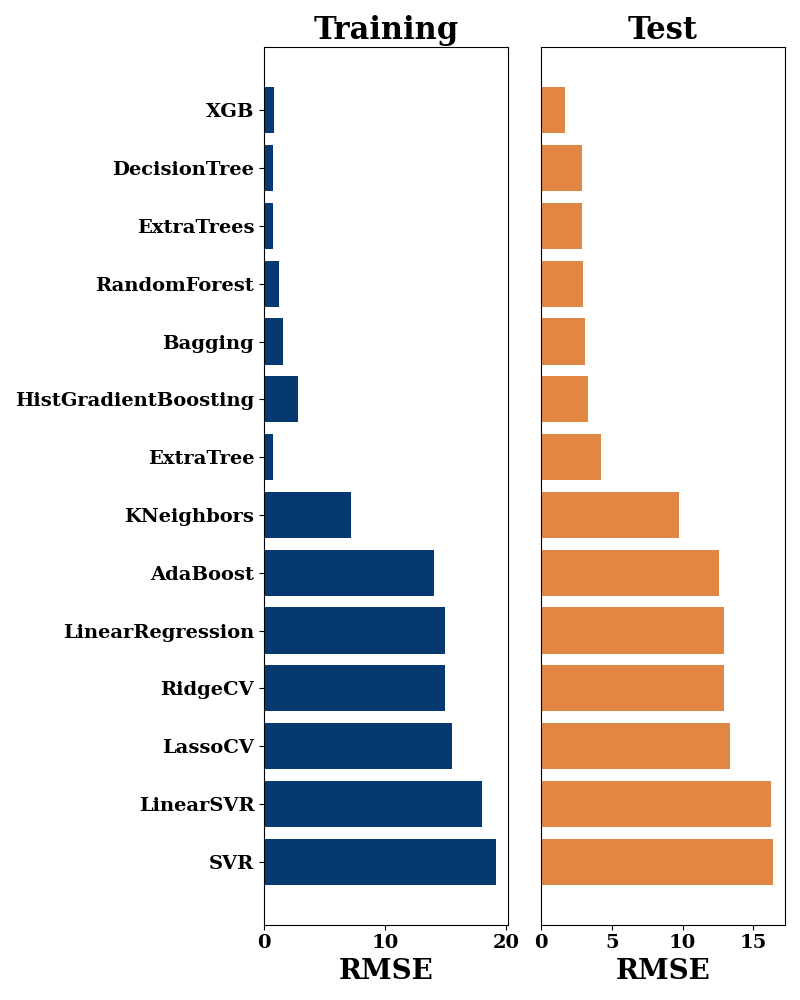
rmse = comparisons.compare_errors(
    'rmse',
    data=data,
    figsize=(8, 10),
    cutoff_type='less',
    cutoff_val=1000,
    colors=('#063970', '#e28743')
)
plt.tight_layout()
plt.show()
***** Training *****
input_x shape:  (584, 14)
target shape:  (584, 1)
***** Validation *****
input_x shape:  (146, 14)
target shape:  (146, 1)
***** Test *****
input_x shape:  (314, 14)
target shape:  (314, 1)
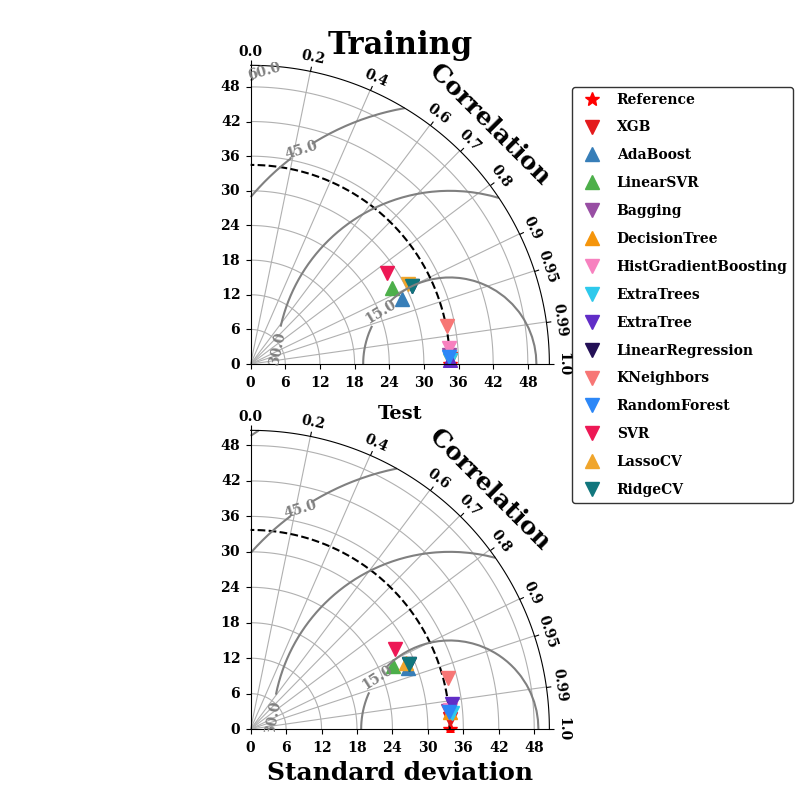
figure = comparisons.taylor_plot(
    data=data,
    figsize=(8, 8),
    include=r2_score.index.tolist(),
    leg_kws={'facecolor': 'white',
             'edgecolor': 'black', 'bbox_to_anchor':(1.0, 0.9),
             'fontsize': 10, 'labelspacing': 1.0, 'ncol': 1
            },
)
figure.axes[0].axis['left'].label.set_text('')
figure.axes[0].set_title('Training')
if SAVE:
    plt.savefig("results/figures/exp_taylor.png", dpi=600, bbox_inches="tight")
plt.tight_layout()
plt.show()
***** Training *****
input_x shape:  (584, 14)
target shape:  (584, 1)
***** Validation *****
input_x shape:  (146, 14)
target shape:  (146, 1)
***** Test *****
input_x shape:  (314, 14)
target shape:  (314, 1)
Total running time of the script: (0 minutes 36.767 seconds)